Regional analysis and plausibility check
Approach
To have an overall idea of the yield variability due to wet or dry conditions across Flanders, a regional analysis was performed. The regional model was constructed by defining a 500 m resolution grid covering the extent of Flanders (Figure 1). This resulted in a set of more than 54000 SWAP-WOFOST simulations. The model was run in these locations for each of the five focus crops: grass, silage maize, potato, winter wheat, and sugar beet. For further analysis, pixels not classified as agricultural land were excluded from the analysis. In reality there are of course rotations and more possible crops. The resulting maps do not represent the real situation in any given year but serve to identify potentially problematic areas for different crop types on a regional scale (conditions that are too wet or too dry).

Figure 1:Raster with 500 m - resolution of the Regional model in Flanders. The red square illustrates one 500 m - resolution grid cell and every dot represents one simulation.
The simulation period was from 01/01/1990 to 31/12/2021 (31 years), to take into account variability in weather conditions. Soil salinity, lateral drainage, and irrigation were not considered in the model, but can be activated for dedicated studies.
Results Regional Analysis
The following results illustrate the effects of the temporal and/or spatial variation in weather, soil, plant and groundwater level conditions on crop yield. All these variables are closely linked to each other and together determine the crop yield in a certain year and location.
Temporal variation
Precipitation deficit (precipitation - reference evapotranspiration, P-ET0) is a commonly used indicator to assess meteorological drought. It indicates whether there was enough precipitation since the beginning of the hydrological season to cover the evaporation demand of the atmosphere. Positive values mean excess or sufficient water availability, and negative values indicate insufficient water availability, from the meteorological perspective. Years with low precipitation, and usually higher temperatures, have a greater precipitation deficit, expressed as a negative value of P-ET0. Figure 2 shows the variability of the average P-ET0 in the last ~30 years in Flanders, cumulated from January to January. The precipitation deficit can also be computed from April to April, which is considered as the hydrological year. Weather conditions vary substantially between years, and different dry and wet periods can be identified. For example, the period 1998 - 2002 was quite wet, while the period 2017-2020 was very dry. Apart from the overall precipitation deficit, the timing of long dry periods is also crucial to estimate its impact on specific crops.

Figure 2:Average precipitation deficit (P-ET0) from 1990 to 2021 in Flanders, showing periods of dry and wet years. Precipitation deficit is calculated from January to January.
Figure 3 shows the average temporal variation of the yield in agricultural areas in Flanders for the five focus crops (on the left), and the average yield reduction due to water and oxygen stress, and indirect effects (on the right). Years 2015, 2018 and 2021 are highlighted in the plots, which are considered “normal”, “dry” and “wet” years, respectively. The potential yield ( maximum potential yield) depicted in grey color, represents the yield that would be produced under optimal conditions of water and nutrients, and if crops are completely protected against weeds, pests and diseases. The actual yield (light green) represents then the estimated yield under the actual meteorological conditions of that year, assuming that nutrients and other reducing factors are not posing any problem so that we can isolate the effects of water stress (too wet or too dry). The red dashed lines represent the average yield from 2012 to 2021 for that crop in Belgium, based on the Belgian statistics “STATBEL” or the Belgian variety list in the case of grass.

Figure 3:Average simulated yield and yield reduction of grass, silage maize, potato, sugar beet and winter wheat in agricultural areas in Flanders from 1990 to 2021. The graphs on the left show the average potential (Ypot) and actual (Yact) yield in ton ha-1 from all simulations. Ypotrepresents the maximum potential yield (see section 2.3.2 of the modelling framework). The average measured yield based on the Belgian statistics “STATBEL” and the Belgian grass variety list is depicted in red dashed line. The figure on the right shows the relative yield reduction (REDTOT= REDdir+REDind =(Ypot-Yact / Ypot)*100+REDind) expressed in %. The colors represent the relative share of the different stress types in the yield reduction. For this we assume that the yield reduction is proportional to the reduction in transpiration (T). The yield reduction expressed in % for each stress type is then (Tdry/(Tpot-Tact))*REDdir(drought stress, red), and (Twet/(Tpot-Tact))*REDdir(oxygen stress, blue).
The temporal weather variability partially determines the inter-annual yield variability of the crops. Yield decrease is higher in years with more precipitation deficit (e.g. 2018, 2003, 2020) than in very wet years (e.g. 1998, 2021). Among crops, some are more sensitive to dry or to wet conditions. Potato, silage maize and sugar beet are almost equally affected by either dry or wet conditions, but potato shows more yield reduction in dry years, probably because of its shallower root system. Grass presents more stable yields through the years compared with the arable crops. Perennial grasses are known to have higher tolerance to oxygen stress compared to arable crops as explained in the chapter Impact of groundwater levels and waterlogging on cultivation factors. Overall, drought stress causes higher yield reduction than oxygen stress, for all the crops except for winter wheat. Winter wheat differs from the other crops in its growing season, which also covers winter and early spring. Furthermore, winter wheat matures quite early in summer, and therefore is often not impacted by summer droughts. Therefore, wet conditions or oxygen stress are the predominant cause of yield reduction in this crop. On average, indirect effects are very low and do not cause high yield losses.
When comparing the simulated yield with the average yield in Belgium depicted in red dashed line (Figure 3), overall, yield variability trends throughout the years are rather well captured for most crops. Yields are systematically underestimated in sugar beet, but relatively, the yields follow the variability over the years. Underestimations can originate from the use of outdated crop parameters in the model ( from cultivars in the 90s) or due to specific field management practices not included in the model, like irrigation events that may be applied in dry years. Overestimations like in 2016 and 2021 for potato, or 2016 for winter wheat, may be also attributed to the presence of pest and diseases that can proliferate in wet conditions, or other indirect effects like root rotting or lodging, which are not accounted for in the model. For example, these indirect effects were mainly the cause of yield reduction in 2021 according to the Agrometeorological Bulletin, and not necessarily oxygen stress. More details about the different factors affecting each of the five crops were described in the chapter Impact of groundwater levels and waterlogging on cultivation factors.
Spatial variation
Precipitation in Flanders varies in space and in time (Figure 4). Consequently, a year considered on average wet or dry, does not cause the same effects everywhere. For example, the province of Limburg was drier in 2018 and wetter in 2021, compared to the rest of Flanders, resulting in a higher yield reduction in this region for both years (Figure 5).

Figure 4:Spatial variability of the precipitation deficit during 2015 (normal year), 2018 (dry year) and 2021 (wet year). Precipitation deficit is calculated from January to January.
The spatial variability of the yield expressed as percentage of yield reduction, in agricultural areas, is shown in Figure 5, for the five crops and for the characteristic years 2015, 2018 and 2021. The maps show the combined effect of the variable weather conditions, the soil heterogeneity and the average water table. Dry conditions lead to more yield loss in silage maize, potato and sugar beet in agricultural areas in Flanders than wet conditions. In the valleys, oxygen stress is the cause of significant yield loss, especially in wet years.

Figure 5:Suitability maps in agricultural areas for grass, silage maize, potato, winter wheat and sugar beet, during 2015 ( normal year), 2018 (dry year) and 2021 ( wet year), based on the regional model.
Soil type is another important factor affecting yield in the model, because soil hydraulic properties control water retention and infiltration rate, and root growth, and thus, determining plant water uptake. The soil texture map link to the soil properties used in the model can be seen in section 3.3.1 of the previous chapter. The model takes into account root growth restrictions based on the clay content, bulk density and pH. Bulk density was approximated with the function of Vereecken (1988), since this information was not available at the regional scale. This function assumes an average value of 1.48 g cm-3 for clayey soils, sandy loam and loam soils. In reality, bulk density can substantially differ from this value. Because of the relationship between bulk density and maximum rooting depth in SWAP-WOFOST, the maximum rooting depth in clay and heavy clay soils is sometimes limited to 10 cm or 20 cm, depending on the crop type (the minimum rooting depth that can be assumed in the model). In general, sandy loam and loamy soils do not limit root growth in the model, and the maximum rooting depth depends on the crop.
The yield reduction maps presented in Figure 5 are closely related to these assumptions. For example, the clayey soils of the polders systematically result in lower yields, because rooting depth was assumed shallow. This is probably not what happens in reality everywhere in the polders. Anthropogenic compaction is another feature which is not represented with approach based on general public data layers. It is therefore important to acknowledge the limitations of models and the data layers they work with, to avoid misinterpretation of the results. For focussed studies on clay soils for example, the link between bulk density and rooting depth could be refined and improved.
Figure 5 shows that areas closer to streams, where groundwater is naturally shallow, always present suboptimal yields (reddish colours). This is exacerbated in wet years. In reality, these areas are mainly used for grass production or grazing, where these shallow groudnwater levels are often already taken into account in current farming practices, since grass is typically more tolerant to wet conditions than other conventional crops.
Franken & Wolfs (2022) studied the potential effect of the increased occurence of droughts due to climate change on groundwater levels in Flanders. According to their predictions, the average highest groundwater level (GHG) will slightly increase due to more precipitation in winter months, in locations with deep groundwater level and a thick aquifer (higher buffering capacity). However, the average lowest groundwater level (GLG) will strongly decrease due to less precipitation in summer months (less water availability) and higher temperatures (more water demand), especially in locations with a thin aquifer, shallow groundwater level and limited lateral flow (lower buffering capacity). According to their predictions: the GLG will drop more than 25 cm in about half of the agricultural land (58 %) and groundwater-dependent nature areas by 2050. In contrast, during winter, the average GHG will increase by maximum 10 cm in 78 % of the agricultural areas. It should be noted that this study is mainly based on data from phreatic aquifers with a clear correlation to meteorological variables, but it is still a good indication of the fact that we can expect an impact of climate change on groundwater regimes. Increasing groundwater buffering capacity is therefore a priority for the government to reduce the increasing water stress-related problems in crops due to climate change.
Effect of groundwater levels and soil texture on crop yield
Figure 6 illustrates the relationship between average groundwater levels and yield across Flanders for the different soil types and for a normal (2015), dry (2018) and wet year (2021). The plots emphasizes the effect of the meteorological conditions and soil type on crop yield, given a certain average water table. This can be seen in the distribution of the point cloud in a certain year and how that probability spreads over the years. In the regional analysis, we use the same average groundwater level or groundwater dynamics ( sinus function) for each year as the bottom boundary condition in the model (so no fluctuating groundwater level throughout the years).
Areas with very shallow groundwater levels (>1m) are negatively affected in wet years, but benefit in dry years. The opposite occurs in deeper groundwater levels, where more precipitation could compensate for the low groundwater contribution. But how positive this effect is, will depend also on the soil texture.
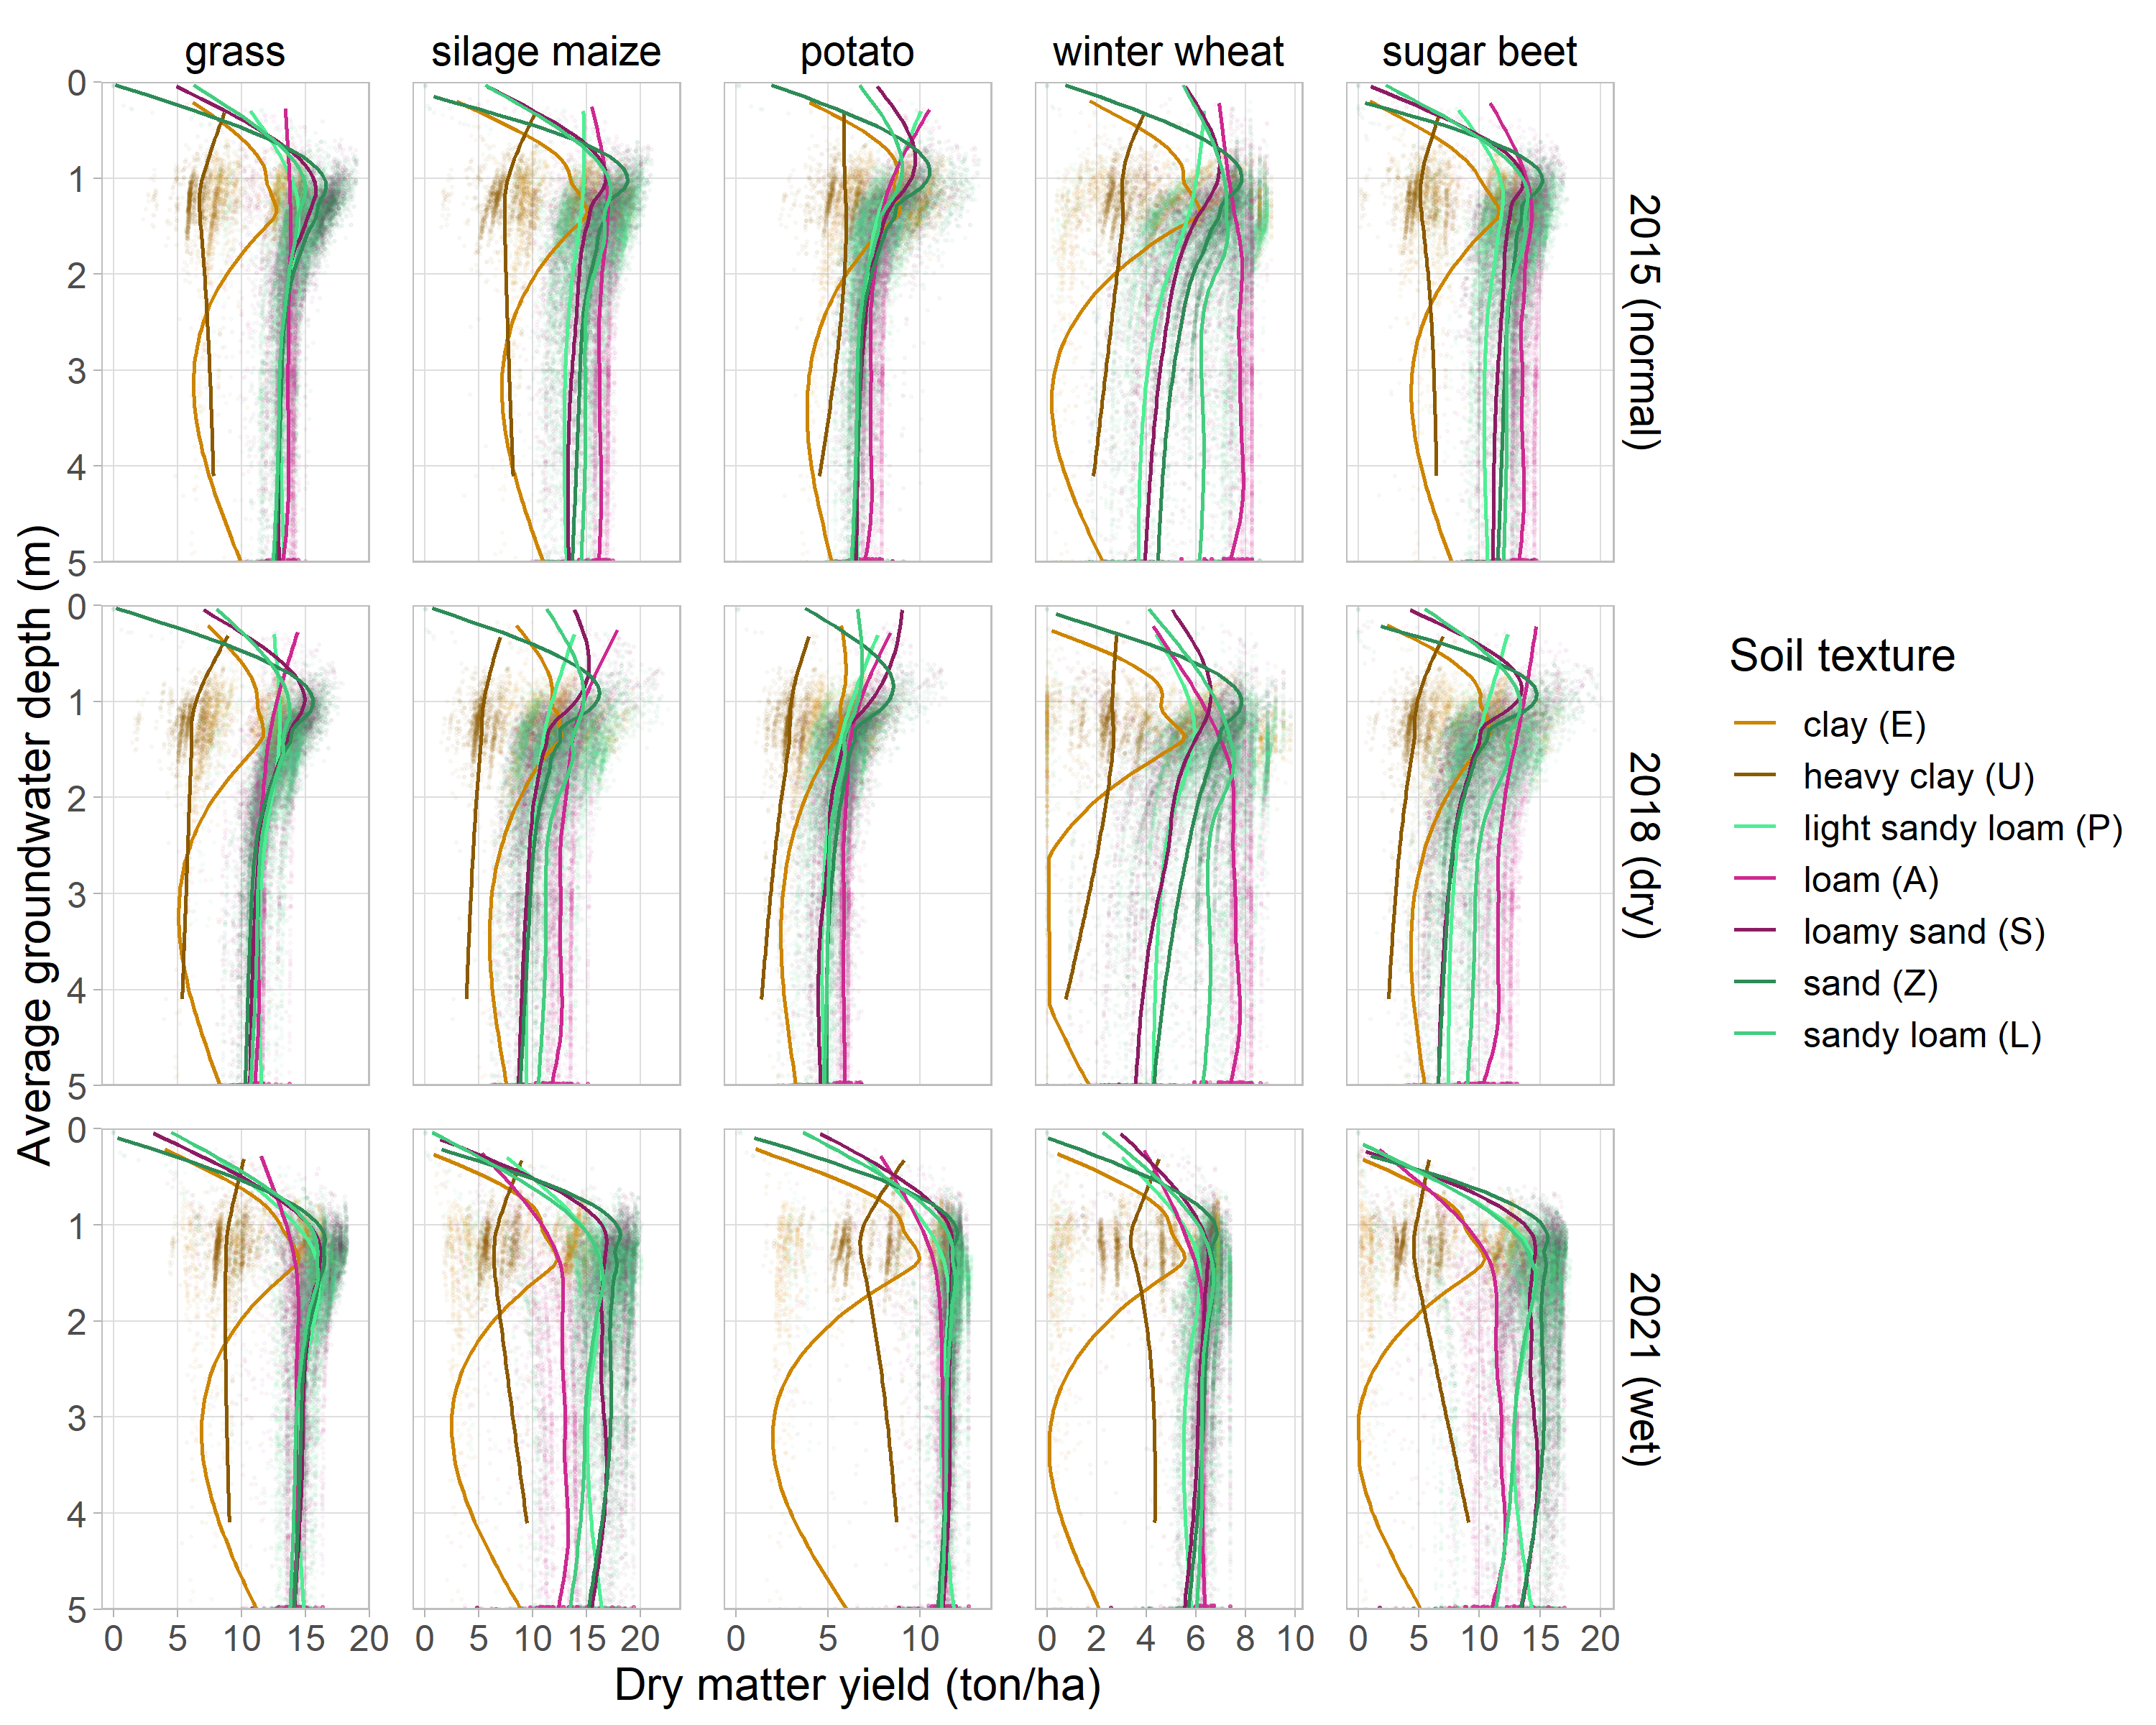
Figure 6:Effect of groundwater, soil type and weather conditions on the yield, for the five focus crops. In the background, the scatter plots contain all simulations of the regional model, and the curves in front represent a trend line for each soil type.
On average, the optimal groundwater level is around 1 m in normal and dry years, and 1.5 m in wet years. However, they also clearly show the large scatter around these averages, which shows it is meaningful not to work with such simple rules of thumb, but rather consider the variability introduced by crops, soils, groundwater dynamics and weather. Shallow groundwater levels cause oxygen stress, while deep water tables lead to drought stress in periods without rainfall. These thresholds are the result of the physical principles included in the drought and oxygen stress functions in the model.
Plausibility Check
SWAP-WOFOST has already been extensively reviewed in the context of the Waterwijzer Landbouw tool in The Netherlands, and in other projects Heinen et al., 2021Mulder et al., 2021Bertram et al., 2017. However, a plausibility check in Flanders is important, to test whether this model can give plausible or acceptable results in the Flemish context. Model validation is not always possible because often the necessary data is lacking. In addition, it becomes even more complex for models incorporating a wide variety of processes and associated parameters like SWAP-WOFOST Heinen et al., 2021. In Flanders, yearly and spatially explicit yield data for model validation or check is not readily available. Therefore, we collected yield data from different experimental institutes across Flanders (Figure 7).
Besides model validation or “plausibility check” , the yield database could serve for:
- Future crop model calibration or validation efforts by any researcher, ILVO and external, respecting the confidentiality level of the datasets ( Open reference yield database in Flanders ).
- Providing an user-friendly tool to keep collecting yield information from various trials in Flanders and compare it with historical evolutions. This could, for example, be used for the Agricultural Impact Report (Landbouweffectenrapport, LER) of the Flemish government.
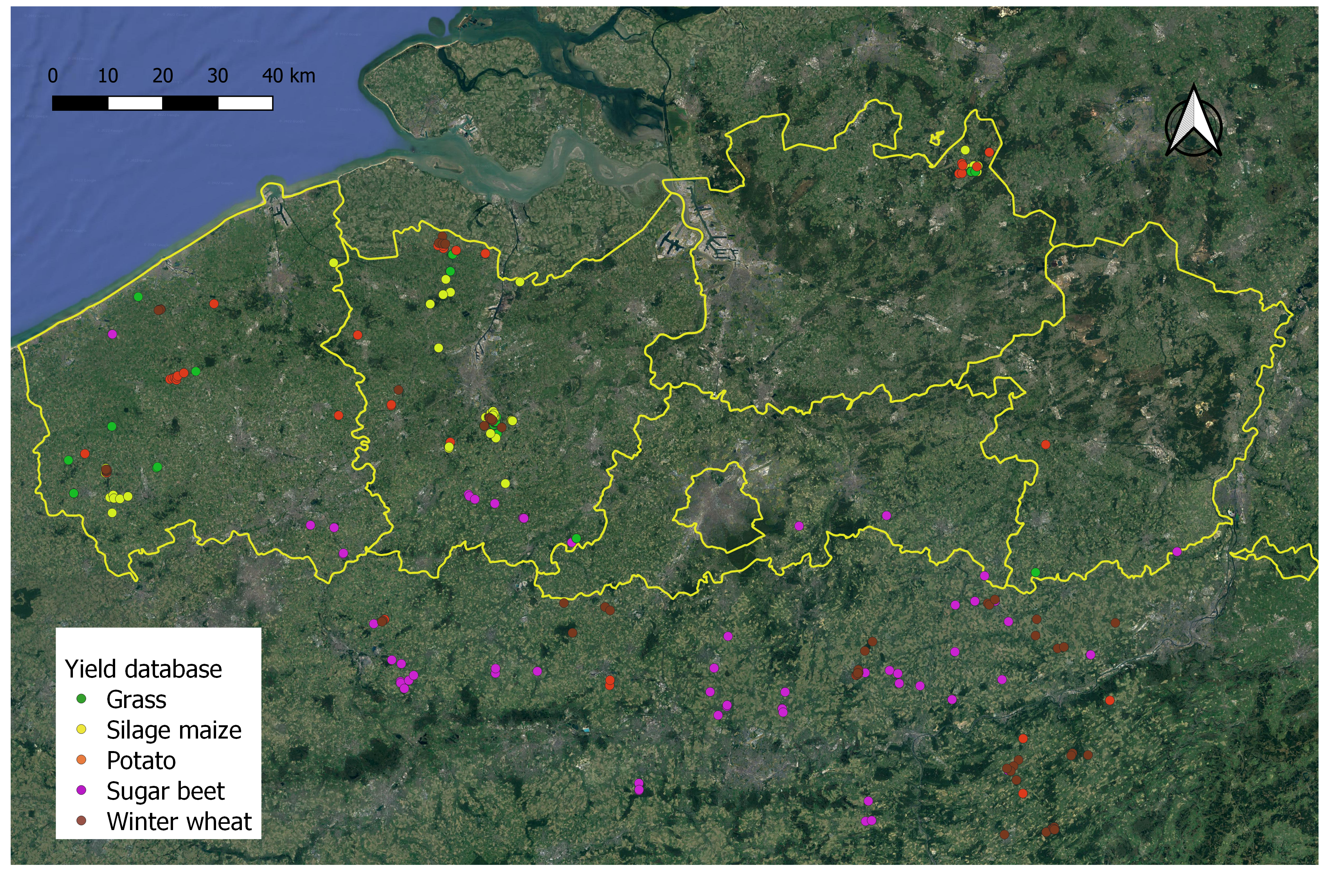
Figure 7:Locations of the yield measurements included in the database. The information outside Flanders was not used in the plausibility check.
The yield database can be accessed in the zenodo repository. Unfortunately, the majority of the data is situated in West- and East-Flanders. The database is freely available and can grow with new input by researchers and professionals collecting yield data.
A first step towards a Flemish yield database
The yield database contains yearly yield data at field level for different arable crops in Flanders, under ‘conventional’ farming practices, along with its coordinate. When available, it also includes the planting/sowing and harvest dates. At the moment, only yield of the five focus crops in this research are included in the database, namely grass, silage maize, potato, winter wheat and sugar beet. The data was collected from different research departments at ILVO and other governmental and private Flemish institutions such us CRA-W and IRBAB KBIVB. Most of the data is the result of variety trials, without irrigation and under normal pest control and fertilizer applications according to the crop’s needs. Only few potato observations come from experimental fields with irrigation or from variety trials performed within farmer fields using irrigation. This yield database would help to represent the spatial and temporal variability of yield in Flanders.
Model setup for plausibility check
The previous chapter (Model framework to evaluate the impact of groundwater levels on agricultural practice) describes the input data and procedures which we followed to generate the simulations for the model check. There is one difference here: site-specific planting/sowing and harvest dates were specified in the model instead of using a generic sowing and harvest date. No indirect effects were calculated in this part.
Before comparing simulated and observed yields, the following should be noted:
Results
Figure 8 shows the relation between measured and simulated yield for grass, silage maize, potato, winter wheat and sugar beet. The black line represents the 1:1 line between observed and simulated yield. In the case of a perfect model, the points would follow the bisector line. More observations are available for grass and silage maize, while for the other crops, especially winter wheat and sugar beet, data is quite limited.

Figure 8:Observed yield (dry matter yield) vs simulated yield for the five crops. The black line is the 1:1 line or bisector line that indicates a perfect fit.
In general, the model tends to underestimate the crop yield, except for grass, even after the 15 % reduction of the experimental yields. The worst underestimation occurs in sugar beet, which is in line with the regional comparison for sugar beet.
One reason can be attributed to the fact that crop parameters used in the model are derived from cultivars in the 90s, and crop yield in modern cultivars have improved substantantially. Allard de Wit, one of the developers of WOFOST, pointed out that crop parameters clearly need an upgrade with recent experimental data.
Another reason can be linked to the preprocessing of the data before model comparison as explained in Section %s. The crop reduction is currently based on expert advice and applied in the same way for all crops. This should be verified by comparing research data with data from farmers for the same crops.
A third reason is related to the fact that the model used in this study does not take into account all the management practices (like irrigation) occurring in a field; therefore, the knowledge of these practices is important for better simulation and interpretation of the model results.
Table 1 shows some statistical indices such us the Root Mean Square Error (RMSE), the relative root mean square error (RRMSE) and coeficient of determination (R2). The RMSE is a measure of the average deviation of the simulations from the observed values. By dividing RMSE by the average observed yield for every crop, it is possible to get a normalized RRMSE, which is dimensionless and comparable across crops. The R2 measures how good the variation of the observed values from the mean value is explained by the linear regression model. These indices give an estimation of how well the model (SWAP-WOFOST) is able to simulate the target value, in this case, crop yield. These values indicate that the model can simulate the crop yield variability of grass and silage maize reasonably well, but it is not able to simulate all the yield variability of potato, winter wheat and sugar beet, with the limited data and model simplifications. It is to be expected that if local information on soil, weather data, groundwater level, and cropping practices were available and used in the model, the results would improve a lot more. Therefore, for a real validation, a (detailed) crop database with a good spread over Flanders should be established.
Table 1:Metrics for model check
RMSE (t ha-1) | RRMSE | R2 | |
|---|---|---|---|
grass | 3.07 | 0.23 | 0.12 |
silage maize | 4.98 | 0.28 | 0.26 |
potato | 3.07 | 0.30 | ~0 |
winter wheat | 3.43 | 0.45 | 0.095 |
sugar beet | 9.36 | 0.43 | ~0 |
The yearly variation of the observed and simulated yield is presented in Figure 9. There is a high variability between years, and within the same year between locations. For example, observed grass yield in 2014 varies between 11 ton ha-1 and 19 ton ha-1, and potato yield varies between 10 ton ha-1 and 15 ton ha-1 in 2019. These differences can be attributed to differences in soil type, and in field-specific management practices such as pest control and nutrient application, but also in local meteorological conditions.

Figure 9:Yearly variation of the observed (red dots) and simulated yield (bar plots) from 2012 until 2021, for the five crops.
High differences between simulated and observed yield in potato in 2019 can be partially linked to irrigation in the experimental fields, which was not included in the model. In sugar beet, the model strongly underestimates the yield in all years, especially in the dry year 2018, based on this small set of observations. In this case, a recalibration of the crop parameters as compared to what was used in WaterVision Agriculture, based on targeted field experiments to calibrate and validate the model is required. Also, a check of the conversion from fresh to dry yield and an assessment of the relationship between experimental yield and farmer yield is needed to improve the model results. Despite all the crop yield variability, the model is able to describe most of these dynamics, although, absolute values are sometimes strongly underestimated like in sugar beet.
Overall, one must not forget no site specific information was used to simulate yields for the experimental sites in order to test whether existing data layers yielded acceptable results. Apart from improving model calibration, significant improvements can be expected if one can work with accurate data on soil horizons and hydraulic properties and local weather data.
Conclusions
We applied the model SWAP-WOFOST at regional scale to describe the crop yield variability due to wet or dry conditions in Flanders. We used historical weather data from 1990 to 2021 and estimated average groundwater levels to simulate the yield of five conventional crops, namely grass, silage maize, potato, winter wheat and sugar beet.
The weather variability between years causes variability in annual crop yields. Simulated yield is on average lower in dry years than in wet years. Potato, silage maize and sugar beet are more sensitive to water stress compared to grass and winter wheat. Grass presents more stable yields throughout the years as compared to the arable crops. Winter wheat is more affected by wet conditions, because a large part of its growing season falls in the rainy months. Spatially, the yield variability is highly influenced by the regional weather variability, soil heterogeneity and water tables. Overall, droughts have more impact on silage maize, potato and sugar beet yields than wet conditions. Areas with sandy loam and loamy soils have normally higher yields than clayey soils, due to less root growth restrictions by the soil.
In general, shallow groundwater levels (less than 1 m below the surface) negatively affect yield in wet years, but benefit in dry years. Just as the yield decreases with deeper groundwater levels, it also decreases when groundwater levels get too shallow. Deeper groundwater levels result in higher yields in wet years, since more precipitation compensates for the low groundwater contribution to crop root water uptake. The extent of this effect depends on the soil texture and the crop rooting pattern.
Based on a dataset with experimental yield observations in Flanders, we demonstrated the model performance. The current model was able to describe general multi-annual trends in average crop yield, despite many limitations in the input data and model simplifications. Although, absolute values are sometimes underestimated, like in sugar beet, where calibration of the crop parameters may be needed to get more accurate results.
This modelling framework is openly available for the research community and efforts should be continued to improve its performance in the future.
- Vereecken, H. (1988). Pedotransfer functions for the generation of hydraulic properties for Belgian soils [Ph.D. diss.]. Katholieke Universiteit Leuven.
- Franken, T., & Wolfs, V. (2022). Effecten van Klimaatverandering op de Freatische Grondwaterstanden (p. 95) [Techreport]. Sumaqua.
- Heinen, M., Mulder, M., & Kroes, J. (2021). SWAP 4 : technical addendum to the SWAP documentation [Techreport]. Wageningen Environmental Research. 10.18174/540451
- Mulder, M., Meijninger, W., & Broeke, M. (2021). Validatie waterwijzer landbouw: vergelijking modelresultaten Groenmonitor, Gram en Help. Stichting Toegepast Onderzoek Waterbeheer (STOWA).
- Bertram, S., Bechtold, M., Hendriks, R., Piayda, A., Regina, K., Myllys, M., & Tiemeyer, B. (2017). Performance assessment and parameterization of the SWAP-WOFOST model for peat soil under agricultural use in northern Europe. 9171. https://ui.adsabs.harvard.edu/abs/2017EGUGA..19.9171B